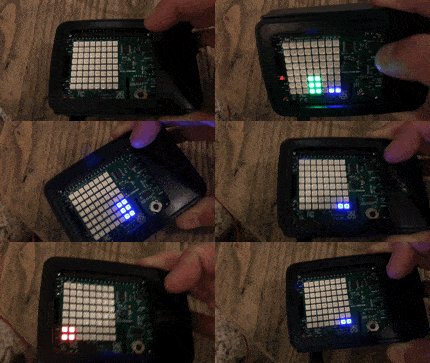
I have watched Raspberry Pi projects and been fascinated with what you could do with a Pi since I listened to Ron Evans from the Hybrid Group talk about teaching kids ruby with a raspberry Pi at GoGaRuCo in 2011. And even with the ridiculously low price point of around $35 I waited 5 years to buy one. I will say that the version 3 is far more capable than the one that sparked the interest in 2011.
I ordered two and turned one into a RetroPie machine and the other I have been using to hack on and teach my son some basics about programming using python and the SenseHat that allows us to get readings for temperature, humidity, pressure, and orientation using gyroscope, magnetometer, and accelerometer. It also has an 8x8 LED matrix that is the really the highlight for the kids.
I will post a few of the goofy apps we wrote as well and some initial configuration that helped me out.
Keyboard Support
The Pi defaults to a UK keyboard mapping which became a big deal when I couldn’t use the | key. This was fixed by setting the keyboard layout with the setxkbmap command.
sudo setxkbmap -layout us
sudo udevadm trigger --subsystem-match --action=change
7” Touchscreen Support
The other purchase that came along with the Pi was a 7” LCD touchscreen. I didn’t pay close enough attention when I got it that I was buying an off brand but it was half the price of the official touchscreen so I am not that worried since it seems to work, although it take some configuring. It was difficult to get the Pi to recognize the dimensions properly. I ended up having to put custom HDMI mode parameters in /boot/config.txt. Like I said this works withe off brand touchscreen so YMMV.
The following is the configuration needed:
# force a specific HDMI mode (here we are forcing 800x480!)
hdmi_group=2
hdmi_mode=1
hdmi_mode=87
hdmi_cvt=800 480 60 6 0 0 0

# give max current to the USB so you can power the screen from the Pi
max_usb_current=1
Playing with the SenseHat
There is a great python library for interacting with the SenseHat. I was new to python so much of this was an experience to learn python as well as play with some new toys.
Catching CTRL+C
One thing that bothered me as we first playing with the LEDs was that when you stop a running script it would persist the latest state of the LEDs. This could be annoying if you weren’t going to be running a script immediately and the bright LEDs were blaring on. So the first thing we did was catch the SIGINT signal and do something a little more graceful.
import signal
import sys

def exit_gracefully(signal, frame):
  sense.clear()
  sys.exit(0)
signal.signal(signal.SIGINT, exit_gracefully)
We will use this in all of our scripts that output to the LEDs.
Bar Graph the Axes
Using the gyroscope, magnetometer, and accelerometer together the SenseHat will get a reading for orientation. We will graph those values as a bar graph on the LED grid. We will convert the degrees of rotation in the x, y, and z axis to a number 0-8 for use in the graph bar. Each axis is converted such that it is 0 when flat and at 8 when rotated 90º on any axis.

import time
import signal
import sys

from sense_hat import SenseHat
sense = SenseHat()

def exit_gracefully(signal, frame):
  sense.clear()
  sys.exit(0)
signal.signal(signal.SIGINT, exit_gracefully)

GRAPH_BAR_HEIGHT = 8
GRAPH_BAR_WIDTH = 2

red = (255, 0, 0)
green = (0, 255, 0)
blue = (0, 0, 255)
black = (0, 0, 0)

sense.set_rotation(270)
sense.low_light = True

def normalize_deg(deg, bound):
  deg = int(deg)
  q = deg / 90
  r = deg % 90
  if (q % 2 == 1):
    r = 90 - r
  return int(r * (bound / 90.0))

while True:
  orientation = sense.orientation
  x = normalize_deg(orientation['pitch'], GRAPH_BAR_HEIGHT)
  y = normalize_deg(orientation['roll'], GRAPH_BAR_HEIGHT)
  z = normalize_deg(orientation['yaw'], GRAPH_BAR_HEIGHT)

  grid = []

  grid += ([red] * x + [black] * (GRAPH_BAR_HEIGHT - x)) * GRAPH_BAR_WIDTH
  grid += [black] * GRAPH_BAR_HEIGHT
  grid += ([green] * y + [black] * (GRAPH_BAR_HEIGHT - y)) * GRAPH_BAR_WIDTH
  grid += [black] * GRAPH_BAR_HEIGHT
  grid += ([blue] * z + [black] * (GRAPH_BAR_HEIGHT - z)) * GRAPH_BAR_WIDTH

  sense.set_pixels(grid)

  time.sleep(0.1)
Binary Clock
Reusing some of the code we did for graphing the orientation we will make a binary clock.

import time
import signal
import sys

import pytz
from datetime import datetime
from pytz import timezone

from sense_hat import SenseHat
sense = SenseHat()
sense.set_rotation(270)
sense.low_light = True

def exit_gracefully(signal, frame):
  sense.clear()
  sys.exit(0)
signal.signal(signal.SIGINT, exit_gracefully)

GRAPH_BAR_HEIGHT = 8

red = (255, 0, 0)
green = (0, 255, 0)
blue = (0, 0, 255)
black = (0, 0, 0)

central = timezone('US/Central')

def digit_to_grid(digit, color):
  digits = []
  while digit > 0:
    if digit % 2 == 1:
      digits += [color]
    else:
      digits += [black]
    digit /= 2
  digits += [black] * (GRAPH_BAR_HEIGHT - len(digits))
  return digits

while True:
  grid = []

  local = datetime.now(timezone('UTC')).astimezone(central)

  hour = int(local.strftime("%I"))
  grid += digit_to_grid(hour / 10, red)
  grid += digit_to_grid(hour % 10, red)

  grid += [black] * GRAPH_BAR_HEIGHT

  grid += digit_to_grid(local.minute / 10, green)
  grid += digit_to_grid(local.minute % 10, green)

  grid += [black] * GRAPH_BAR_HEIGHT

  grid += digit_to_grid(local.second / 10, blue)
  grid += digit_to_grid(local.second % 10, blue)

  sense.set_pixels(grid)

  time.sleep(0.5)